SXY and MIC plotters
The GetControl allows you to export (via export menu on the Main form) the profile or microstructure charts using Python scripts. Any time you open the helper of the plotter by clicking the menu item, the application saves the script into the working directory.
Caution
If you already have the sxy-plotter.py or mic-plotter.py file in the directory, the file will be overwritten without warning. If you make some adjustments to it, they will be lost. If you want to change or adjust the content of the scripts and you want to be permanent, please use the Special menu in the Editor. It allows you to save your changes into the script, which will be saved in the config folder, and anytime you want to use the plotter, the application will copy your local version from that directory.
Each plotter has some settings which need to be provided to work properly. You can use the special forms (they appear when clicking the appropriate menu) designed to help you with the command line formation (see below).
Advanced users can try to run the command below for the SXY plotter in their terminal, and the script will provide you with instructions for help. Others can click Show the script hints button to see the help in editor.
python sxy-plotter.py --help
Attention
The scripts need Python3 to run. Depending on your Python system settings, you may need to adjust the name of the executable to python3.
How to work with the helpers
The way of working with the script helper forms is very similar for both plotters. You select what files you want to plot, and then you can adjust some captions/titles/phase descriptions and decide if you want to export the final chart to a file. The form will create the command line in the text editor. You can adjust it as described below; for example, you change the title string or X-axis range, copy it into the clipboard, paste it into the terminal, and hit enter.
For most of the actions, there are buttons which do the job for you (copy the command line, open the terminal in the working directory, etc.).
SXY plotter helper
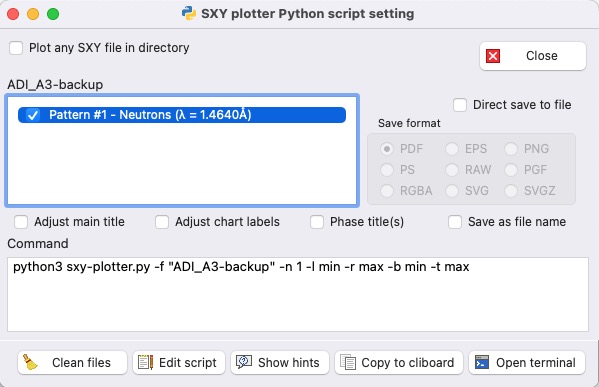
The SXY plotter can plot multiple patterns at one chart with linked X axis. You can plot all patterns from your multi-pattern refinement (you will see the list of patterns available in your refinement), or you can even plot patterns from different refinements. For that, you need to check Plot any SXY file in directory. Then, you can select what SXY files are available.
The SXY files are created by the GetControl whenever the helper is open. It means that when the dialog is open and you select another PCR file in the Main form, the SXY files are created for that PCR file (the existing ones are overwritten).

SXY plotter helper
Caution
When you plot multiple patterns, be aware of the X-axis setting. When you want to compare various radiations, switch X-axis setting to Q or d spacing.
Files and checkboxes
- Files to plot
Select the appropriate pattern index or the SXY file (when plot any SXY file is selected) to plot. If you are not happy with the order (the first one will be on the top of the chart), then adjust the order after the
-fparameter (for plot any SXY file) or after the-nparameter (index of the pattern in the multi-pattern PCR).
- Adjusting X and Y axis ranges
-lleft and-rrightDefault:
-l minand-r maxChange the
minormaxto any value you want; be aware of your X-axis spacingAll charts have the same linked X-axis!
-bbottom and-ttopDefault:
-b minand-t max, for multi-pattern:-b min,min,minand-t max,max,maxChange the
minormaxto the any value you wantIn the multi-pattern plot, the Y axes are individual for each pattern, and then there is a list of values; change the one you need
Further, you can adjust some other properties such as titles, captions, phase names, etc. Those options will be added to the command when you select them by checking the appropriate checkboxes. Below is the description of those options.
- Adjust main title
The default main title is taken from the title of PCR. If you want your own, check this option. It adds
--title "-"in to the command line. You can change the text in the quotation to your own (for example,--title "My new main title).If you want to remove the main title, then set the title to the following
--title "#".
Tip
In the strings for title, captions and phase names, you can use the LaTeX notations, for example, --title "Pattern of H$_2$O$_2$"
- Adjust chart labels
Default chart labels are radiation and wavelength*. If you want to change it, check this option. It adds
--labels "-"in to the command line. You can change the text in the quotation to your own (for example,--labels "My new main title). If multiple patterns are plotted, provide the text for all patterns or leave"-"for default (example:--labels "Neutrons D1B","-","X-Ray in my lab").If you want to remove the chart label, then set it to the following
--labels "#"or--labels "-","#"in the case of multi-pattern (it will remove the chart label only at the second pattern).
- Phases title(s)
Default phase titles are taken from the PCR (SXY file). If you want to change it, check this option. It adds
--phases "-"in to the command line. You can change the text in quotation to your own (example:--phases "Phase1"). If there are more phases, you can adjust each of them or leave"-"for default (example:--phases "Phase1","-","TiO$_2$").When multi-pattern is plotted than there is
@separating the patterns (example:--phases "Ph1-Pat1","Ph2-Pat1"@"Ph1-Pat2").
Note
If you want to see the Braggs for each pattern, you have to set Save Bragg positions in Pref->General tab to XY for each phase.
- Direct save to file
If checked, the script will save the chart in the selected format. The format can be selected by clicking the appropriate option. The default is
PDFformat.
- Save as file name
If this option is checked, the Direct save to file will be activated automatically. It adds
--save-as "-"into the command line. You can adjust the text in quotation to the appropriate file name to save the chart figure. Don’t add the extension. If not provided or"-"used, the title will be used.
MIC plotter helper
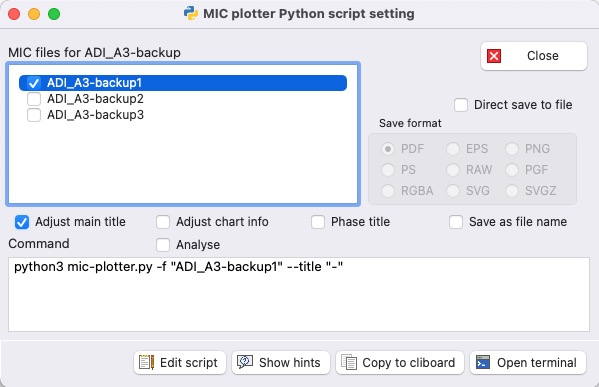
The MIC plotter can plot the content of MIC files one at a time. The MIC files are created by the FullProf any time the IRF file is provided during the refinement. But until you start to refine microstructure parameters that files are without any useful information to be plotted, then you will see the Microstructure tab on the Main form. If the microstructure parameters are refined, then you can use the MIC plotter to plot summary charts.
Working with the MIC plotter helper is very similar to the SXY plotter helper. So, for the various adjustment options, please refer to the proper description there. The main difference is that MIC plotter can plot only one MIC file at a time, and any title, caption, phase name adjustment has one string in quotation " ".

MIC plotter helper
There is also a missing button Clean files as MIC files are created during refinement and are not generated by GetControl as in the case of SXY files for SXY plotter.
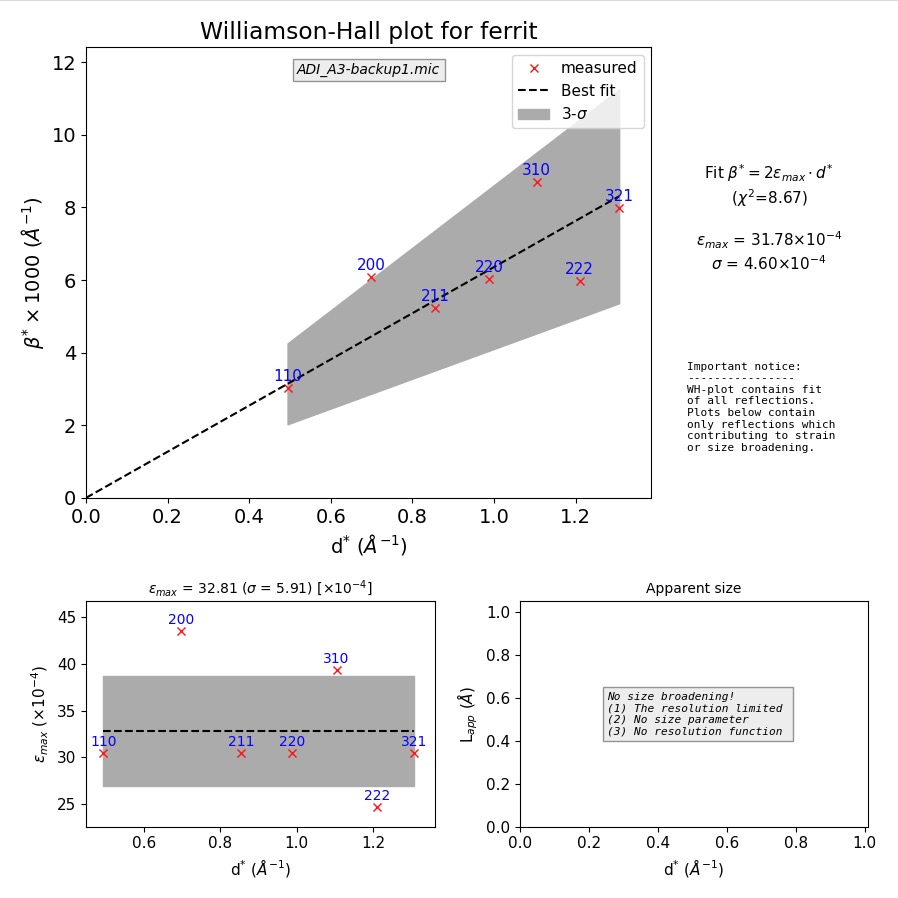
But there is one additional checkbox Analyse. If checked, the script tries to fit the Williamson-Hall (WH) plot and provides some basic analysis. An example of the output from the MIC plotter is shown in the picture below.
Attention
The analysis of the WH plot works only when symmetric microstructure broadening is refined. For the anisotropic broadening, it makes no sense.

Example of the MIC plotter output


